Security Activity Is Not the Same as Measurable Risk Reduction
A Universal Zero Trust Network Access (UZTNA) program generates extensive operational data. Availability, log volume, policy hits, and alert counts help technical teams run the environment, but they do not answer the board’s question:
Is the organization becoming harder to compromise and better able to limit damage?
Positive activity and health indicators are not evidence that risk is declining:
- Uptime can be excellent while applications remain behind broad VPN access.
- Alert volume can rise because detection improved, risk increased, or tuning deteriorated.
- Logs can multiply without producing an actionable detection.
The board needs a small set of quarterly KPIs tied to exposure, containment, governance, and financial impact. The following measures translate a UZTNA program from a technology deployment into an operating discipline.
These measures draw on The Practitioner’s Guide to Universal Zero Trust Network Access, a broader framework for architecture, readiness, deployment, and operations. This article narrows that framework to the outcomes boards need to assess progress and risk reduction within a Zero Trust program.
KPIs for Exposure: Shrink the Attack Surface and Blast Radius
1. Percentage of access migrated off VPN
This KPI measures the share of user-to-application access that no longer depends on network-level VPN connectivity. It shows whether broad network access is being replaced with application-specific, context-aware access.
Why it matters: Direct measure of program progress
A migration plan that never retires legacy access paths leaves the old risk model intact. Present a quarterly trend with the remaining VPN-dependent use cases and why they have not moved. Improvement means the percentage rises while permanent exceptions decline, not merely that UZTNA capacity has been deployed.
2. Percentage of applications published behind UZTNA
VPN migration describes the access path; application coverage describes the protected estate. This metric measures how much of the application portfolio is governed by UZTNA policy, continuous verification, and application-level access controls.
Why it matters: Coverage of the application estate
For the board, this shows how much of the business the program protects. Report overall coverage separately from high-value and high-risk applications, so low-impact migrations do not hide critical gaps. Improvement means prioritizing critical applications and assigning remediation or retirement plans to unsupported legacy systems.
3. Lateral-movement attempts blocked
This measure counts observed attempts to move beyond an authorized application, segment, or resource boundary that were denied by policy. It demonstrates defensive value more directly than raw alert volume because it connects enforcement to a behavior associated with expanding an intrusion.
Why it matters: Quantifies the control’s defensive value
Report on the affected assets, the control that intervened, and whether the cause was malicious activity, misconfiguration, or excessive privilege. Zero attempts is not necessarily the goal. The stronger signal is that credible attempts are blocked, investigated, and used to refine policy.
KPIs for Faster Containment: Prove Controls Work After Access
1. Mean time to detect and contain an access anomaly
UZTNA should continuously evaluate identity, device posture, application access, and risk, not make a one-time decision at login. Mean time to detect and contain measures how quickly the organization recognizes abnormal access behavior and applies an effective response.
Why it matters: Maps to incident response performance
Report on the median and high-percentile results, not only an average that can hide slow cases. Separate detection from containment when possible and show the quarterly trend. Improvement means both intervals decline and more anomalies are handled through tested workflows rather than improvisation.
2. Mean time to revoke a session
Session revocation is the operational truth test. The sets a target of under 60 seconds from the decision to revoke access to the termination of the active session. That is concrete, testable, and directly connected to limiting damage.
Why it matters: Proves quick termination of risky access
Report the percentage of tested or real events completed within 60 seconds and the slowest material cases. Exercise the metric through simulations, such as a stolen credential paired with a posture downgrade, rather than assuming performance from configuration. Improvement means consistent sub-60-second revocation across access scenarios.
KPIs for Financial and Governance Value: Expose Control Debt and Business Impact
1. Open policy exceptions and average age
Exceptions may be necessary, but unmanaged ones become control debt. This KPI tracks their number and age to show whether temporary accommodations are being reviewed, narrowed, and retired.
Why it matters: Health of policy hygiene
Show the total, aging distribution, and number tied to critical applications or privileged access. A decreasing average age is more meaningful than a one-time reduction in count. Improvement means every exception has an owner, scope, expiration date, and compensating control.
2. Cyber-insurance premium impact
This KPI translates security investment into financial language. The result may be a premium change, improved underwriting assessment, reduced exclusions, better terms, or evidence supporting renewal discussions. It should not be presented as a guaranteed saving from one control.
Why it matters: Translates security spend into financial terms
Report verified changes and insurer feedback alongside the UZTNA evidence supplied during underwriting. Directional improvement means the organization can demonstrate stronger access governance and containment capabilities in a form that insurers and risk leaders can evaluate.
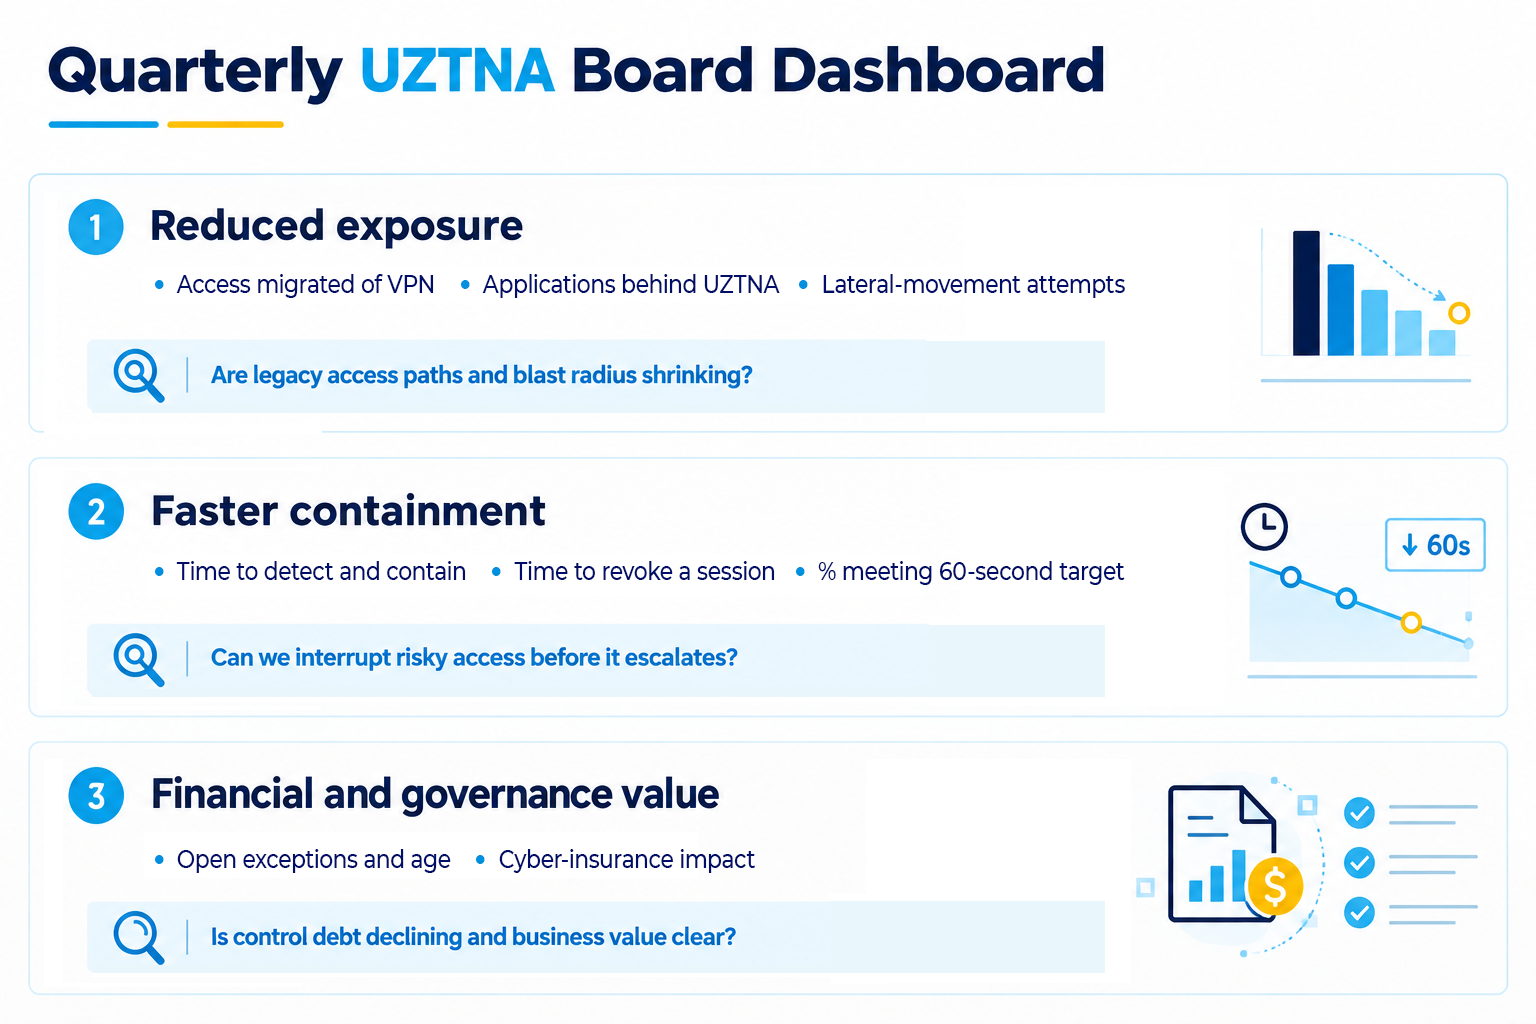
A Concise, Quarterly Board Dashboard
Each metric should include a current value, prior-quarter value, target or threshold, trend, and concise explanation of material exceptions. Avoid turning the board pack into a SOC console.
Where Forescout Contributes
A board dashboard is only as credible as the evidence behind it. If devices and access paths go unseen, reports on application coverage, policy effectiveness, or containment speed rest on an incomplete picture. The Forescout Vistaro™ platform supplies that evidence across managed and unmanaged IT, OT, IoT, IoMT, and cloud assets through four connected capabilities, each tied to the KPIs above:
- Discover: Continuously identify and classify every connected asset without agents, establishing an accurate denominator for VPN migration and application coverage.
- Assess: Correlate posture, behavior, vulnerabilities, and compliance data into business-aware risk scores, strengthening the signal behind access decisions and anomaly detection.
- Control: Apply dynamic policy, segmentation, and automated response such as quarantining devices or blocking traffic, creating the enforceable boundaries that limit lateral movement and speed containment.
- Govern: Centralize policy management with continuous validation, reporting, and audit-ready evidence, making exception aging and control debt visible to risk leaders and insurers.
With integrations across 180+ security and IT products, these capabilities feed the wider ecosystem rather than adding another silo. The outcome is a dashboard grounded in complete coverage and measurable enforcement, so the board sees risk reduction rather than activity.
Start With a Baseline, Then Make the Trend Unavoidable
Four steps turn these KPIs into a repeatable board discipline:
- Define the denominator. Establish the full set of known access paths, applications, device classes, and policy exceptions for each coverage metric.
- Capture a baseline. Record starting values before expanding enforcement.
- Validate containment. Run recurring exercises, including session revocation and blast-radius testing.
- Report consistently. Present the same small KPI set every quarter so the board can separate durable improvement from a one-time deployment milestone.
UZTNA is not complete when the platform is live. It is working when the organization can show that:
- Broad access is disappearing
- Critical applications are covered
- Suspicious movement is constrained
- Risky sessions are terminated quickly
- Exceptions are aging out
- Business stakeholders can see the value in terms they recognize
Take the Next Step
Ready to build a UZTNA program your board can measure?
- Know where you stand: Take the free, 15-minute Universal ZTNA Maturity Assessment to see where Zero Trust is defined versus where is it actually enforced across IT, OT, IoT, and legacy environments.
- Get the roadmap: Explore The Practitioner’s Guide to Universal Zero Trust Network Access for a sequenced plan covering architecture, readiness, deployment, and day-two operations.
- See it in action: Explore Forescout’s Universal ZTNA to learn how continuous visibility, dynamic policy, and automated enforcement turn these KPIs into measurable outcomes.
- Hear directly from the author of the guide: Watch and listen to Dr. Chase Cunningham discuss in our webinar: “Your Zero Trust Program is Half-Scoped”.